The Line Below Box Office: A Guide to Who Pays for the Plays You See
November 2, 2026
People

Adam Elsayigh
ERI/PS2 Public Research Fellow
Cairo-born and Dubai-raised, Adam Ashraf Elsayigh is a playwright, dramaturg, and Ph.D. candidate in Theatre and Performance at the CUNY G.C. His plays – including Alaa: A Family Trilogy and Drowning in Cairo – have been developed or presented by NYTW, The Lark, Sundance, and Golden Thread. A Lucille Lortel Awards voter, in 2025, Adam was selected as World Theatre Day’s U.S. Emergent Artist. He holds a BA from NYU Abu Dhabi, MFA from Brooklyn College, and is a Georgetown Laboratory for Global Performance and Politics fellow.
Off-Broadway’s programming choices are usually explained through artistic vision. This summer, I’m testing a competing hypothesis: that money is doing a lot of the deciding. I’ll be building a public dataset tracking financial and programming records across four major Off-Broadway institutions from 2008 to 2025, developing early visualizations that map the relationship between funding structures and curatorial choices, and beginning conversations with artists about whether the patterns in the data match what they’ve already felt in the room. My aim is to turn shared intuition into a public resource the field can build on, argue with, and use. Elsayigh is a 2026 ERI/PS2 Summer Fellow.
If you have seen a play at New York Theatre Workshop (NYTW), the East Village theatre where Rent began, you might assume your ticket paid for it. My research asks what that assumption leaves out: how who pays for a theatre, and how each theatre chooses to be paid, shapes what it puts onstage. This summer, as a PS2 Public Research Fellow, I began a fifteen-year record of what four Off-Broadway theatres earn and stage: NYTW, Playwrights Horizons, Atlantic Theater Company and Roundabout Theatre Company.
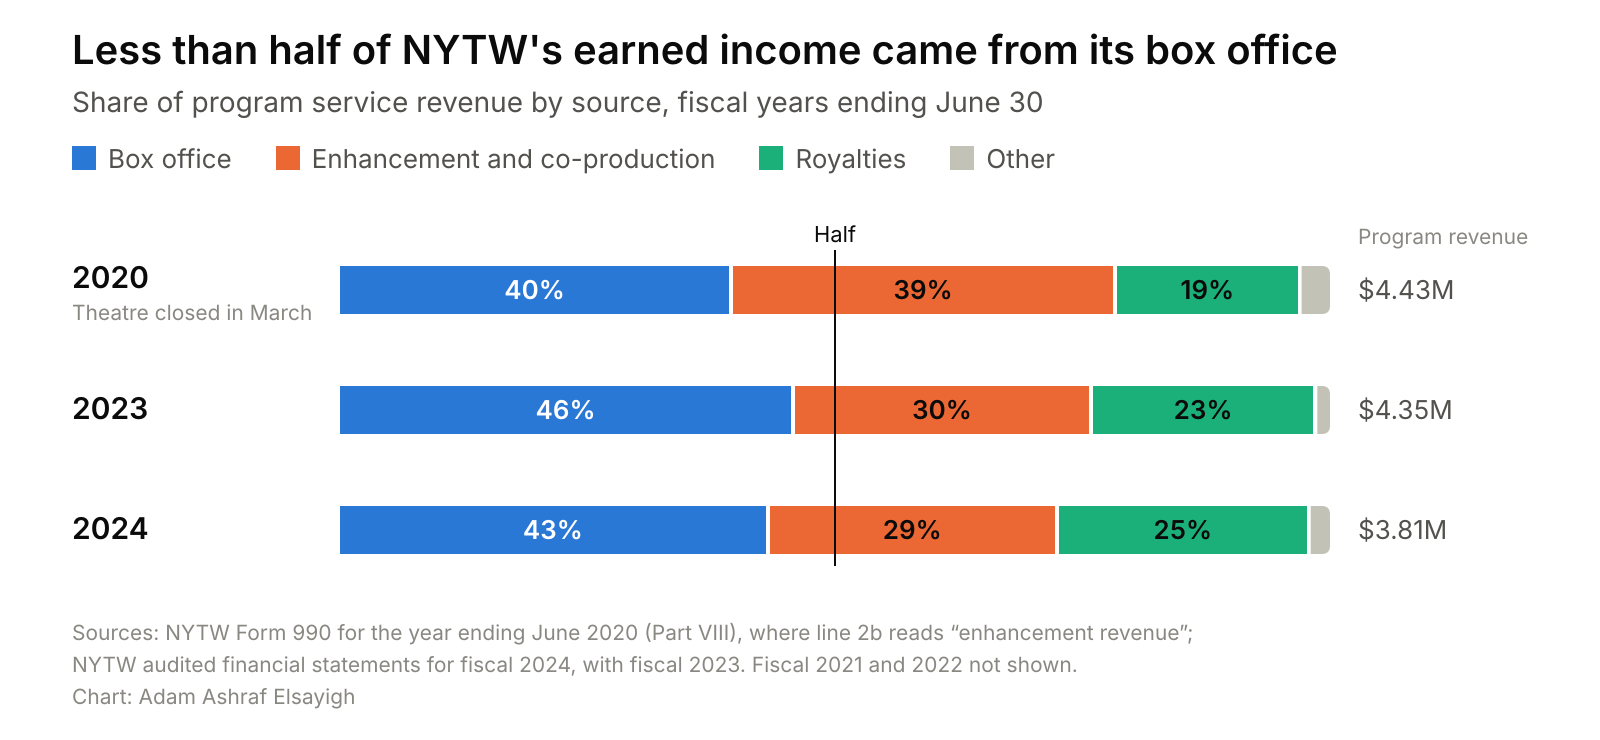
In this post, I test that assumption against one example from that record. NYTW’s own tax return says otherwise. On page 9 of its return for the year ending June 2020, the theatre reports its “BOX OFFICE INCOME” as $1,757,464, about a fifth of everything it took in. The line beneath it, “ENHANCEMENT REVENUE,” comes within $42,000: $1,715,760. That is money commercial producers put into a nonprofit production for a stake in its future. The next line “ROYALTY INCOME,” adds $825,619 from shows that started there and moved on.
The pandemic closed the theatre that March, cutting that year short, so I checked NYTW’s audited statements for 2023 and 2024. The pattern held in both. All told, tickets brought in less than half of what the theatre’s programs earned.
When more than half of what a theatre earns comes from somewhere other than its tickets, mostly commercial partners and past hits, it is fair to ask what that does to the next season. That is the question underneath this project, and a theatre’s tax return is where the answer starts.
One theatre’s return is only an example. Across all four theatres, I expected to find donors replacing audiences. The filings tell a more complex story. Pick any two years and you can tell almost any crisis story, so I tested the comparison I planned to lead with: the share of Playwrights Horizons’ revenue that came from gifts and grants nearly doubled between 2013 and 2022. Of 78 pairs of years at least three years apart, that pair turned out to be the second most dramatic.
Earned income shows a steadier pattern. Playwrights Horizons earned $6,488,190 from its programs in fiscal 2014 and $6,487,574 in fiscal 2025, a difference of $616. Factoring in inflation, its program revenue from 2023 to 2025 averaged about a fifth less than from 2011 to 2019, while NYTW’s grew by about 15 percent. Two theatres in the same city, over the same years, moved in opposite directions. The next stage of this work matches these financial records to each company’s productions, season by season.
Theatre workers ask what money does to their next season, audiences live with the answer onstage, and funders who want to back risk rarely see these lines side by side. Before I publish a field brief on these findings, each theatre will see its own profile and can answer in print. If we ask nonprofits to show their work, researchers owe the same.
You can take this further than I can. Pull up a recent return for a theatre whose seasons you know (ProPublica’sNonprofit Explorer posts them free), find the page where it lists what it earns in its own words, and set that year’s season beside it. You may know what the form leaves out: which show arrived with a producer attached, which hit made the next risk possible. What would that season have looked like without the line below box office?
Sources
- New York Theatre Workshop, Form 990 for the year ending June 30, 2020, Part VIII and line 12.
- New York Theatre Workshop, audited financial statements for fiscal 2024, with fiscal 2023.
- ProPublica Nonprofit Explorer: Playwrights Horizons, NYTW, Atlantic Theater Company, Roundabout Theatre Company.
- Inflation: the U.S. Bureau of Labor Statistics CPI-U for New York-Newark-Jersey City, which I average over each theatre’s fiscal year. The averages compare fiscal 2011 to 2019 with fiscal 2023 to 2025, in fiscal 2025 dollars.